Market Reports
Following are links to the updated real estate market reports for the most recent month of 2019:
Simply Click on the 2019 1st Quarter Remax Neighborhood Market Report Desired Below:
Palos Verdes Peninsula 2019 1st Quarter Market Information
Manhattan Beach and Hermosa Beach 2019 1st Quarter Market Information
Redondo Beach 2019 1st Quarter Market Information
Torrance 2019 1st Quarter Market Information
San Pedro 2019 1st Quarter Market Information
My most recent Palos Verdes Peninsula city market reports trend analysis for the 1st quarter 2019:
City of Palos Verdes Estates 1st Quarter 2019 Single Family Real Estate Market Report
City of Rancho Palos Verdes 1st Quarter 2019 Single Family Real Estate Market Report
City of Rolling Hills Estates 1st Quarter 2019 Single Family Real Estate Market Report
City of Rolling Hills 1st Quarter 2019 Single Family Real Estate Market Report
Palos Verdes Peninsula ( All Cities ) 1st Quarter 2019 Single Family Real Estate Market Report
Palos Verdes Peninsula ( All Cities ) 1st Quarter 2019 Condo and Townhome Real Estate Market Report
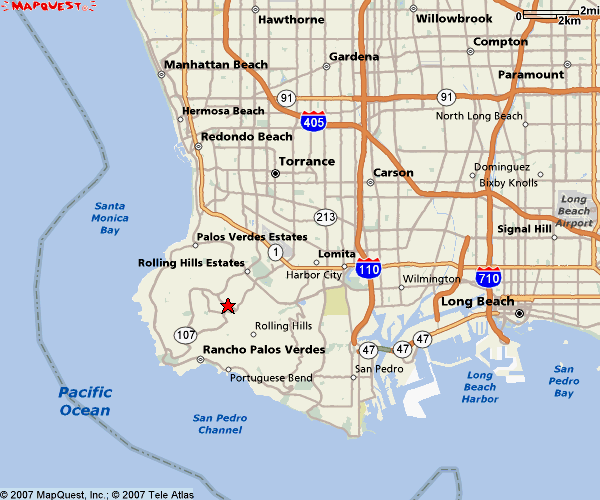
2019 1st Quarter Market Report Palos Verdes Peninsula and South Bay Single Family Homes
Palos Verdes Peninsula:
The real estate market sales activity for the Palos Verdes Peninsula for the 1st Quarter of 2019 had overall sales volume decrease about 21% and the inventory of homes for sale is 18% higher than at the end of the 1st quarter 2018, which is equal to about 5 months of inventory. Sellers who are motivated to move are pricing their homes to sell. Interest rates have moved back down about 1/4% during the 1st quarter of 2019, and buyers are still taking advantage of relatively low interest rates.
PRICE CHANGES:
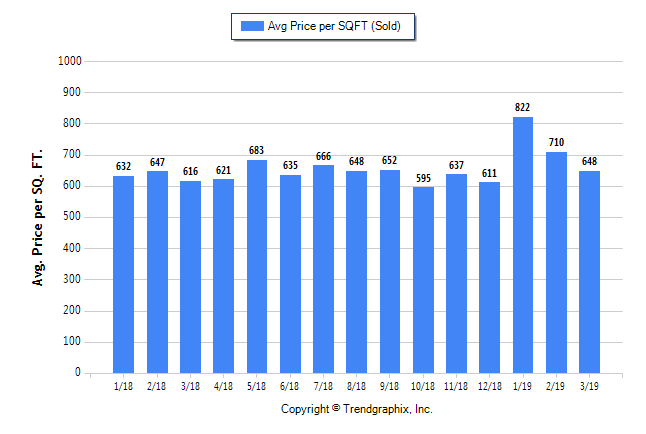
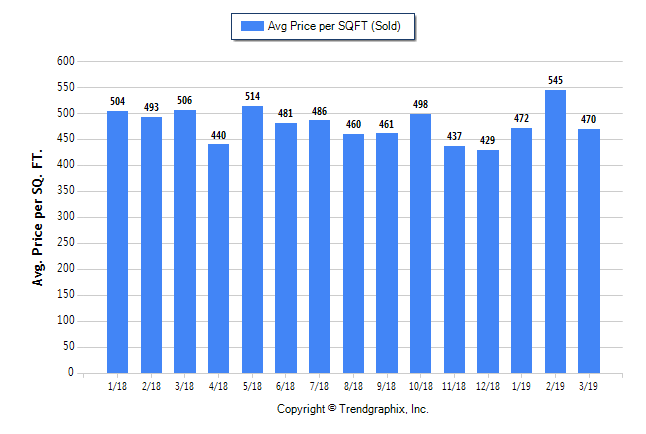
Properties, on average, on the Palos Verdes Peninsula are selling for approx. 93% of list price.This indicates that Sellers are negotiating their prices and are motivated to sell. Despite this,the average price per sq. ft. for Palos Verdes homes sold in the 1st quarter 2019 of $696 compared to the 1st quarter 2018, is 11% higher, but varied city by city.
The following is a chart of the sales price per sq. ft. for homes on the Palos Verdes Peninsula. ( Note: I prefer to analyze average price per sq. ft. trends as the more often quoted “median” sales price is highly dependent on the mix of homes sold between less expensive homes and higher-end homes):
The following is a chart of the number of single family homes for sale, sold, and currently in escrow with contingencies removed ( Pended) on the Palos Verdes Peninsula.
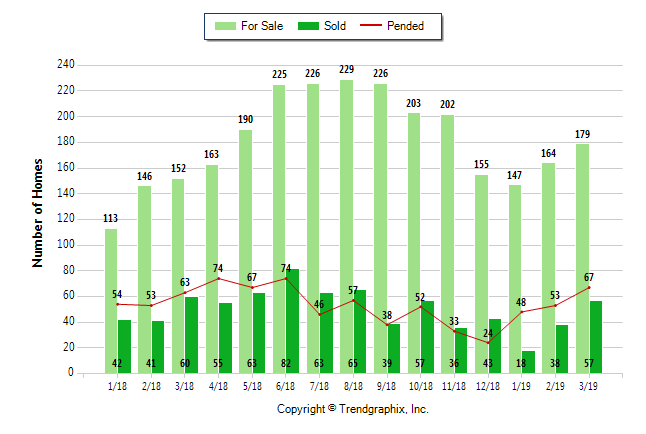
Sales volume has averaged 38 homes sold per month during the 1st quarter, an decrease of 21% compared to the 1st quarter of 2018. There are 179 homes listed for sale as of the end of March 2019, 18% higher compared to the same time last year. There are 67 homes in escrow at the end of the 1st quarter 2019.
South Bay:
The figures included in the table below for the cities in the South Bay are only for the three months in the 1st Quarter of 2019:
| Location | 2019 1st Qtr. Sales | % Change from 1st Qtr. 2018 | Months Inventory | ||
|---|---|---|---|---|---|
| Sales Price Per Sq.Ft. |
# of Houses | Sales Price Per Sq. Ft. |
Sales Volume |
||
| Palos Verdes Estates | $757 | 27 | ( 4%) | ( 35%) | 7 |
| RPV, RHE & PVP | 609 | 81 | 6% | (15%) | 4 |
| Rolling Hills | N/A | 5 | N/A | N/A | N/A |
| Manhattan Beach/Hermosa |
1,187 | 75 | 13% | 1% | 5 |
| Redondo Beach | 719 | 60 | ( 7%) | ( 21%) |
3 |
| Torrance | 532 | 143 | 4% | 9% | 2 |
| San Pedro | 452 | 54 | 5% | ( 28%) | 2 |
The total inventory of single family homes for sale in the cities listed above at the end of March 2019 is up approx. 32% compared to the prior year, and sales activity for the 1st quarter is down 11%, and there is about 3 months of inventory. Homes in the lower end of the price range have also been selling faster than the higher priced homes. Average price per sq. ft. for homes sold in the 1st quarter 2019 for the cities listed above is still up approx. 10% overall compared to the 1st quarter of 2018 in spite of the slow down in sales activity.
FINANCING (See our web blog at http://mmegowan.activerain.com/ for rate updates):
Interest rates for 30 year fixed rate Conforming Loans ($484,350 and below) as of 4/15/19 are at approx. 4.0-4.3%, down about 1/4% compared to the end of the previous quarter . Rates for 30 year loans between $484,350 and $726,525 (conforming jumbos) are approx. 4.1-4.2% , and 4.0-4.1% for jumbo loans (loans over $726,525 ), and 15 year conforming loans are about 3.5-3.6% (3.4-3.8% for conforming jumbos and 3.8% to 4.0% for jumbo loans). Conforming loans generally require a 20% down payment (less for FHA or VA loans). All rates above assume a 20% down payment, no points and a FICO score of at least 740. Rates can vary significantly between lenders.
First Quarter 2019 Market Analysis for Palos Verdes Peninsula Condos and Townhomes
The average price per square foot of condos and townhomes sold on the Palos Verdes Peninsula over the last 3 months of $487 per sq. ft. a decrease of 3% compared to the similar period last year.
The following is a chart of Palos Verdes Peninsula condos and townhomes for sale and sold over the last year .
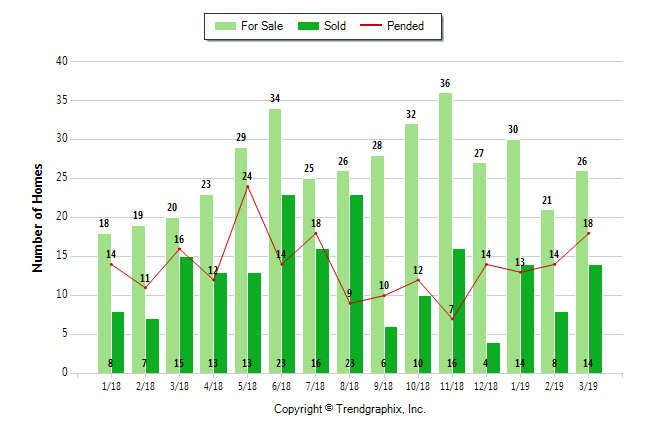
The inventory of unsold condos and townhomes on the Palos Verdes Peninsula of 26 units at the end of March is 30% higher than at the same time last year. The average number of sales per month over the last 3 months of 12 units per month is up approx. 20% compared to the same period a year ago. There are 18 units in escrow with contingencies removed (pended) at the end of March
To check out the various condo and townhome projects on the Palos Verdes Peninsula, see the following link on my website :PV Condos & Townhomes / Townhouses . Each of these project descriptions have an analysis of recent prices paid for sales in each project.COPYRIGHT NOTICE:
Graphics, content and html coding may not be reproduced or copied in any way with out written permission from Maureen Megowan All html coding, layout and original content and graphics are copyrighted – Maureen Megowan and may not be used, copied or reproduced on another web site. Maureen Megowan makes no guarantees or warranties as to the information provided herein


